 Written by Leland Jeppesen
| How Fixed Index Annuity Plans Work | Do FIA Plans Perform as Projected? |
| Are Fixed Index Annuities Worth It? |
|

Fixed Indexed Annuity Plans are becoming all the rage these days with both seniors and pre-retirees looking to bolster their retirement planning. This can be attributed to the lure of account growth potential while also offering guaranteed principal protection during market downturns. Sales on FIAs, Fixed Indexed Annuities, are up over 20% versus just a year prior. Since much of this hype is centered around non-guaranteed growth it is worth asking;
- How do Fixed Index Annuity Plans work?
- Do Fixed Index Annuity plans perform as projected?
- Are Fixed Index Annuities worth buying?
This article will cover all three of these points so you know exactly what is going on with Fixed Index Annuity Plans and more.
How Fixed Index Annuity Plans Work
Fixed Index Annuities are derivative products where the account values grow based on a stock market index, such as the S&P 500 or Russell 2000. The account owner is not investing directly in the stock market, but rather pegging the account performance to the market performance with limitations. Since you are not investing directly in the market, your insurance agent does not have to be securities licensed to sell you a Fixed Index Annuity, unlike Variable Annuities.
Just like with a traditional Whole Life insurance contract, Fixed Indexed Annuities consist of two parts; a guaranteed side that shows the contractual values, and the non-guaranteed side that shows the possible account growth based on the index chosen. These non-guaranteed values, which often look so enticing, are calculated based on:
A. Your market Index/es chosen
B. The performance of such index/es
C. The index crediting limits set by the insurance company
D. The changes the annuity company makes to such limits over time
The accuracy of the non-guaranteed values depends on all of the above, but it all starts with what is called an illustration.
Illustrations
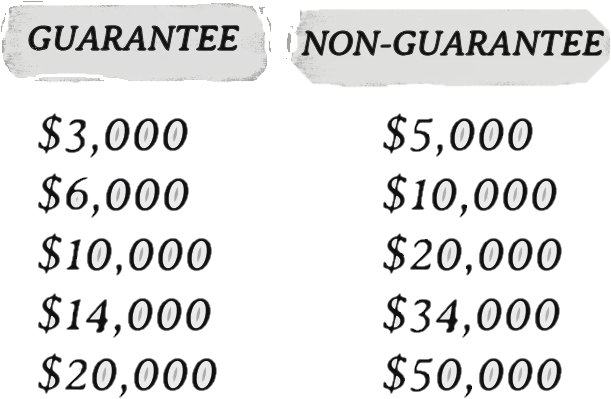
Fixed Index Annuities, like all annuities, have what is called an illustration. This is where your non-guaranteed values are listed. The illustration is simply two columns of numbers; on the left side you will find a column with the heading ‘GUARANTEED VALUES,’ and on the right side you will find another column of numbers with ‘NON-GUARANTEED’ above.
Sample Illustration
It is a bit more involved than the above sample, but you get the general idea. The illustration is provided to a client at the point of sale or at least included in the contract at point of delivery. Your non-guaranteed numbers are presented based on your supposed market index’s future performance. So, if the index has historically grown 10% on average over time, then your account may show a 10% average growth moving forward. That’s the general idea but there are some limitations. Those index crediting limitations can make a big difference over time. Let’s take a closer look.
Indexing

Regardless of which stock market index/es you choose, your plan will have a segment, or period of time during which you are credited for market performance. Normally, a segment lasts 1 year but it may also go longer or shorter. So, if you hold a plan for 50 years, with a 1- year segment, then there would be 50 times that your account could be credited for any market gains.
If your Index is the S&P 500 and at the end of the 1st year the index went up, then your account value would also normally go up too. Dollars are then added to the account value in your contract. Your account would be credited a portion or all of that performance, possibly even more, but we will get into that later.
Likewise, if your S&P 500 index goes down during your segment, then your account values would not be affected but would hold level based on your last segment’s value or your renewal date. So, in essence, you get part or all of the upside and zero of the downside risk. Zero is your hero as they say with these plans! These renewal dates are essentially when your index’s gains are locked-in. So, no matter what happens in a subsequent segment, your values will not be any lower than the previous contract anniversary or annuity’s renewal date.
To demonstrate this, let’s use an example. The below hypothetical graph shows the S&P 500 index with an annual point-to-point strategy, or 1-year segment. Obviously, our graph is not tracking the S&P 500 daily, since we only care about the value at the end of our segment, 1 year. That is why the S&P line is linear, unlike a traditional stock market graph. But let’s say on 1/1/2023 the S&P is at 4000 when you start your contract with a $100,000 contribution and on 1/1/2024, let’s say the index reaches 5000. Well, your account value would receive at least some, if not all, of this 25% gain as you can see in year 1. Conversely, if in the 2nd year the index crashed from 5000 to a resulting 1,500 on 1/1/2024, then your account value would stay level outside any normal account fees. Make sense? So, zero is your hero in a downturn but your account would normally go up if the index goes up. Now I hear you ask; how much does it go up? For that we need to look at the crediting variables; Caps, Spreads, and Participation.
Indexed Annuity Account Value with S&P 500 Index

Caps, Spreads, and Participation

Each index also has a possible cap, spread and/or participation. It’s highly unlikely your account will have all three of these, but at least one will be part of your plan. So, in the earlier example, your S&P index went up 25% during the 1st year’s segment. If you had a participation rate of say 300%, (which is within the current market offerings by the way), then your credit would look like this;

So your participation can act as a multiplier to your performance! Wow, looks great so far, right? But what if the participation was 60%? It would then look like;

Well, here you can see your participation acts as a divider to your performance, resulting in a reduced credit toward your account balance. So, participation can swing both ways here, multiplier or divider, lover or fighter. This makes a big difference over time. We will get into this more shortly.
Next, you may have a cap. If your index had a cap of say 10% your credit would look like;

So, a cap can act as a limit on how much upside performance your index annuity account value may have..
And last but not least, we have something called ‘spread’. Again, you will likely not have a participation, cap AND spread, but just to be sure we cover all bases; spread is the difference between what the market yields and what you receive. So, if your spread is 2% and the index does 25%, here is how it would work;

I hope all that makes sense. While this might seem a bit overwhelming, remember Fixed Index Annuities will not likely see all three of these in any one index, just one if not two. Participation and cap are common, while spread is a bit less so. When you buy your plan, the index will list which variables are used to calculate your performance credit. This does help a little bit l. You can also have more than one index selected in any one plan if you want to make it more complicated. So you could have an S&P 500 with just a participation rate along with the Russell 2000 with just a cap. You could, for instance, allocate 50% of your account to each of these indexes’ performance. So, if you had $100,000 in your account then you could have $50,000 tracking the S&P 500 and $50,000 tracking the Russell 2000. Know also, that whatever index you choose has the crediting variables already selected by the insurance company. You would not be able to switch the S&P 500 from a participation rate to a spread or the Russell 2000 from a cap to a participation in this example. But, each contract anniversary, you could change your index strategy. So you could then allocate 100% to the S&P 500 and 0% the the Russell 2000 for example. You certainly do not have to use more than one index in a plan, but it is available. In fact, you could have many more than two indexes or simply choose a fixed interest rate as your index strategy if you feel the market is headed for a downturn in the next segment. This way you would have a guaranteed interest rate during your coming segment. So you have lots of choices. But just so we keep things simple, our examples will focus on one index strategy moving forward.
Now, at some point you might have thought, what a wonderful world this is, where I have zero as my hero during a down market but could also have a credit to my account beyond the market performance? With participation rates available today in excess of 300%, this certainly seems like the case, but let’s go back to the illustration for a moment.
Do FIA Plans Perform as Projected?

Your Fixed Indexed Annuity Illustration Might Be Totally BS
Remember, your illustration consists of two parts; the guarantees on the left and the hypotheticals on the right. When your advisor/insurance agent/cousin/etc shows you your illustration, they are going to show the hypotheticals based on what your index is projected to do assuming historical data holds. So, if you choose the S&P 500, the illustration looks back over maybe 10 to 20 years and then shows you the performance moving forward assuming the same historical numbers are recycled in the future. Here’s why this can be deceptive;
Caps/Spreads/Participation rates can change on each contract anniversary, or renewal date of your segment.
So, if your segment is a 1-year point-to-point, then each year your cap/spread/participation will likely be different and this will affect, possibly drastically affect, your hypothetical numbers. So, even if your market index does exactly the same as the historical look-back, your actual numbers will likely be radically different for this reason alone! So, sure market performance could change your numbers vs the illustration BUT the insurance company may make the bigger variable! And guess what else? Your precious illustration does not take any of that into consideration whatsoever. It assumes the cap/spread/participation rates stay exactly the same as the initial rates when you purchase. It considers NO change in that regard. Well, we all know that change is part of life, so maybe you could excuse this oversight, but wait there’s more…Most insurance carriers do not offer the same cap/spread/participation numbers to existing client renewals as to new sales.
This is so freaking huge it can not be overstated! Remember, the insurance carriers want new sales and so offering a participation rate of even 400%+ might be used to entice new business. But a high participation or cap is very likely going to be cut at the point of renewal. So, two people with the same insurance company, same product, same index strategy, but one a new client and one an old client, can have dramatically different caps/spreads/participation rates! And you can expect new sales rates to be more favorable than the existing client’s renewal rates. Not all insurance companies offer different renewal rates versus new sales, but many of them do and the illustrations will only show hypothetical numbers based on the initial rates! For this reason alone, know that your non-guaranteed illustration could be off by miles!Insurance carriers may not readily offer historical data on their caps/spreads/participation rates for renewal money.
This makes it incredibly hard to calculate how accurate your illustration is. Even using historical index performance it is almost irrelevant when you can’t also see historical data on rates generated from the insurance carrier. Remember the cap/spread/participation rates WILL change and the illustration does not consider this. Focusing only on the initial sales rates is highly problematic and self-serving to the carrier. And to add one more crinkle to all the above…Renewal rates on caps/spreads/participation may not be the same, even on the SAME product and index.
So, if you bought XYZ Fixed Annuity with an S&P 500 in 2022, and I bought the same exact carrier/product/index in 2021, our renewal rates could be totally different. Why? Not sure, but it does add more complexity to getting accurate numbers out of your illustration when old money renewal rates are broken up based on year of purchase.
Now, the vast majority of buyers are unaware of the above and even many seasoned advisors are oblivious as well. But to drive everything home, let’s take some real numbers from a large A-Grade insurance company that provides Fixed Indexed Annuities to the public employee market. Here are the real numbers;

The above is based on NEW money, so new sales. That participation looks amazing, acting as a multiplier here. Now, let’s see what recent historical RENEWAL money rates look like using the same carrier/product/index;

Wow, we have over a 10% differential on the credit in just one year! That is what happens when the participation moves from a multiplier on market performance to a divider at 70%!
So, how does this affect overall performance? Let’s look at what this does over a 20 year time horizon. But just to give the insurance company the benefit of the doubt, let’s hold that renewal participation at 90%. It’s much better than the first renewal we had at 70%, which was the accurate renewal for 2021 buyers on this product. The below shows how this would look vs. the hypothetical sales illustration showing a 210% participation throughout the contact. We will fund both examples at $6,000/yr. The below does also include a 1% fee as a rider charge.
Non-Guaranteed Illustration With 210% Participation for Index Annuity
| Year | Funding | Participation | Index Performance | Credit | Credit Interest | Income Rider | Accumulation Value |
|---|---|---|---|---|---|---|---|
| 1 | $6,000 | 210% | 9.49% | 19.93% | $1,195.80 | $0.00 | $7,195.80 |
| 2 | $6,000 | 210% | 3.75% | 7.88% | $1,034.16 | $71.96 | $14,158.00 |
| 3 | $6,000 | 210% | 13.56% | 28.47% | $5,698.67 | $141.58 | $25,715.09 |
| 4 | $6,000 | 210% | 0.56% | 1.17% | $368.06 | $257.15 | $31,826.00 |
| 5 | $6,000 | 210% | 3.84% | 8.07% | $3,026.87 | $318.26 | $40,534.61 |
| 6 | $6,000 | 210% | 9.30% | 19.53% | $9,009.04 | $405.35 | $55,138.30 |
| 7 | $6,000 | 210% | 1.28% | 2.69% | $1,629.79 | $551.38 | $62,216.71 |
| 8 | $6,000 | 210% | 10.70% | 22.48% | $15,195.25 | $622.17 | $82,789.79 |
| 9 | $6,000 | 210% | 9.93% | 20.85% | $18,340.05 | $827.90 | $106,301.94 |
| 10 | $6,000 | 210% | 0.00% | 0.00% | $0.00 | $1,063.02 | $111,238.92 |
| 11 | $6,000 | 210% | 9.49% | 19.93% | $23,144.02 | $1,112.39 | $139,270.55 |
| 12 | $6,000 | 210% | 3.75% | 7.88% | $11,337.57 | $1,392.71 | $155,215.41 |
| 13 | $6,000 | 210% | 13.56% | 28.47% | $45,456.13 | $1,552.15 | $205,119.39 |
| 14 | $6,000 | 210% | 0.56% | 1.17% | $2,446.10 | $2,051.19 | $211,514.30 |
| 15 | $6,000 | 210% | 3.84% | 8.07% | $17,382.71 | $2,115.14 | $232,781.87 |
| 16 | $6,000 | 210% | 9.30% | 19.53% | $46,179.48 | $2,327.82 | $282,633.53 |
| 17 | $6,000 | 210% | 1.28% | 2.69% | $7,688.21 | $2,826.34 | $293,495.40 |
| 18 | $6,000 | 210% | 10.70% | 22.48% | $66,666.79 | $2,934.95 | $363,227.24 |
| 19 | $6,000 | 210% | 9.93% | 20.85% | $76,226.55 | $3,632.27 | $441,821.52 |
| 20 | $6,000 | 210% | 0.00% | 0.00% | $0.00 | $4,418.22 | $443,403.30 |
The above are the results with an account valued at $443,403. This is a 12.22% annual return, which blows away the historical S&P return of 10.2%. This is due to that wonderfully high participation rate. Too bad these numbers are bogus! But hey, they do look nice on paper for enticing sales. Now, let’s assume a 90% participation renewal rate using the same product, same $6,000/yr funding and same index strategy.
Non-Guaranteed Illustration With 90% Renewal Participation for Index Annuity
| Year | Funding | Participation | Index Performance | Credit | Credit Interest | Income Rider | Accumulation Value |
|---|---|---|---|---|---|---|---|
| 1 | $6,000 | 210% | 9.49% | 19.93% | $1,196 | $0.00 | $7,196 |
| 2 | $6,000 | 90% | 3.75% | 3.38% | $445 | $71.96 | $13,569 |
| 3 | $6,000 | 90% | 13.56% | 12.20% | $2,388 | $135.69 | $21,822 |
| 4 | $6,000 | 90% | 0.56% | 0.50% | $140 | $218.22 | $27,744 |
| 5 | $6,000 | 90% | 3.84% | 3.46% | $1,166 | $277.44 | $34,632 |
| 6 | $6,000 | 90% | 9.30% | 8.37% | $3,401 | $346.32 | $43,687 |
| 7 | $6,000 | 90% | 1.28% | 1.15% | $572 | $436.87 | $49,823 |
| 8 | $6,000 | 90% | 10.70% | 9.63% | $5,376 | $498.23 | $60,700 |
| 9 | $6,000 | 90% | 9.93% | 8.94% | $5,961 | $607.00 | $72,054 |
| 10 | $6,000 | 90% | 0.00% | 0.00% | $0 | $720.54 | $77,333 |
| 11 | $6,000 | 90% | 9.49% | 8.54% | $7,118 | $773.33 | $89,678 |
| 12 | $6,000 | 90% | 3.75% | 3.38% | $3,229 | $896.78 | $98,010 |
| 13 | $6,000 | 90% | 13.56% | 12.20% | $12,693 | $980.10 | $115,723 |
| 14 | $6,000 | 90% | 0.56% | 0.50% | $613 | $1,157.23 | $121,180 |
| 15 | $6,000 | 90% | 3.84% | 3.46% | $4,395 | $1,211.80 | $130,363 |
| 16 | $6,000 | 90% | 9.30% | 8.37% | $11,414 | $1,303.63 | $146,473 |
| 17 | $6,000 | 90% | 1.28% | 1.15% | $1,756 | $1,464.73 | $152,765 |
| 18 | $6,000 | 90% | 10.70% | 9.63% | $15,289 | $1,527.65 | $172,526 |
| 19 | $6,000 | 90% | 9.93% | 8.94% | $15,955 | $1,725.26 | $192,756 |
| 20 | $6,000 | 90% | 0.00% | 0.00% | $0 | $1,927.56 | $196,828 |
Wow! This changed the final account value down to $196,828 with an annual return of 4.92%! That is a $246,575 dollar difference! And if we continued the above example for over 30 years the difference is even larger; over a $1M dollar difference! That’s what happens when an indexed annuity’s participation rate swings from an initial 2X+ multiplier to a divider at 90%. Remember, the most recent renewal rate is sitting at 70%! So you could say we were quite generous to the annuity insurance company with these numbers, the difference could be much larger. The real return came out at 4.92%, which reminds me of something; old-school whole-life insurance returns. Might you be better off with a Whole Life contract? Maybe. At least you would avoid a few moving parts in an indexed plan. We could also demonstrate similar swings by varying caps or spread rates over time as well.
So will an Indexed Annuity’s non-guaranteed values hold up and perform as projected over time? The short answer; absolutely not! Non-guaranteed numbers will never perform as projected. These values are only a projection, but much-worse, often manipulated based on the changing crediting limits. Will the non-guaranteed values at least be close or in the ballpark to what is shown? Well in the above example we were off be over 100% off! If you currently hold one of these plans, then I am sorry to inform you that there is a strong chance the numbers you were presented with were grossly exaggerated compared to what will actually pay out or accumulate. And the longer time that illustrated was shown the stronger that exaggeration may be. Better to offend someone with the truth than disappoint at a time of financial need in my opinion.

Even the fine print may not give the full picture
Are Fixed Index Annuities Worth It?
So, are Fixed Index Annuity Plans worth it? FIAs are an insurance-based product afterall and the reason for insurance is to transfer risk. If the guaranteed-side of the contract can show an effective way to transfer risk, then it could be worth buying, but as we discussed, these plans are often touted for their non-guaranteed values. There are, however, two risks that a Fixed Annuity could effectively help transfer;
- Longevity Risk. Seniors are more concerned about outliving their money than death and most of these plans offer what is called an income rider. This works similarly to a pension or social security offering guaranteed income for a set period of time or the rest of your lifetime, depending on which option you choose. Or even the rest of a spouse/dependent’s lifetime if you wish. Once you have your annuity contract, the longer you wait to start the income, the larger the payout. This is much like social security or many pension plans. It is advised to shop the annuity companies to see who offers the largest payouts on the guaranteed-side of the contract.
- Market Loss Risk. All FIA plans offer zero as your hero, essentially removing market volatility from affecting the principal. Unlike a variable annuity, Fixed Index Annuities will not be affected by market downturns. If you have money in the market and cannot afford a 40% drop like in 2008, this could be a real benefit to securing your retirement. Just know your plan will also likely not get the full upside of the market when there is a rebound or even as much as what your illustration shows, as we have covered.
What to Ask
If you do find yourself ogling non-guaranteed values, then at least ask the following before buying a fixed index annuity;
- What is the current cap/participation/spread rate/s on the index?
- What are the recent renewal rates on the same product/index?
- What have these renewal rates been historically (fyi your insurance agent/financial advisor may not know)?
- Are there different versions/editions of the same product? And if so, what were the previous version’s renewal rates? (Some carriers release different versions/editions of the same exact product making it harder to find out historical rates).
And if you are getting a plan because of either the guarantees or non-guarantees, be aware of the surrender charges with these plans. Most index plans will have a penalty if you end the contract early. The earlier you do this, the higher the penalty. Surrender schedules can even exceed 10 years
Conclusion
In closing, know that the non-guaranteed values are speculative at best, deceptive at worst, and for far too many seniors, disappointing at the point of payout. Don’t let rosy expectations of numbers, even from a well-meaning financial advisor/insurance agent, keep you from doing due diligence and being informed. Buy insurance for what it will do, not what it might do. If the guaranteed values do not meet your needs, then it may be best to avoid Fixed Index Annuities.


